EU Council Recommends Its Members to Reintroduce Restrictions on American Travelers
August 31, 2021 - Due to the increase in infections and delays in the vaccination process, some countries, including the US, would be removed from the safe list of several European countries, on the recommendation of the EU Council. Should Croatia follow these measures?
HrTurizam writes that national representatives of the Council of the European Union met yesterday, Monday afternoon, to discuss and update the EU's safe travel list, a process that takes place every two weeks.
The EU Council has decided to remove six countries from the list: Israel, Kosovo, Lebanon, Montenegro, Northern Macedonia, and the United States, claiming that their current coronavirus infection rate exceeds the agreed threshold of 75 new cases per 100,000 inhabitants in the last 14 days.
The US vaccination campaign has stalled in recent months and has lagged significantly behind EU vaccination efforts. More than 57% of the EU population is fully vaccinated against COVID-19, compared to 52% in the United States. The U.S. has more than 1,000 new cases a day, the highest level since March.
Removal from the EU safe list means that trips that are not important again become subject to temporary travel restrictions, such as testing, quarantine, or a total ban.
However, compliance with the recommendations is not mandatory. Some EU countries have the right to decide unilaterally whether to keep their borders open to US travelers. On the other hand, America still does not allow European travelers free entry into the country.
The presence of American tourists in Croatia has been positive in the August statistics so far, and even September arrivals are still expected. At the moment, the United States is on Croatia's safe list, which means that that the travelers arriving from the USA do not have to provide any reason for their travel in order to enter Croatia. They will be required to prove that they’ve been vaccinated or have recovered from COVID and that they haven’t spent any significant time outside of the “green countries”.
Follow the latest flights to Croatia HERE and the latest travel updates and COVID-19 news from Croatia HERE.
For all you need to know about coronavirus specific to Croatia, make sure to bookmark our dedicated COVID-19 section and select your preferred language.
Nenad Bakic: Why Has the Virus Become So Deadly in the New EU Countries?
December 20, 2020 – The European Union has so far recorded over 300,000 deaths caused by the coronavirus pandemic, with the second wave being 50 percent more deadly than the first one. It is easily possible that the total number will exceed half a million by the time the pandemic is brought under control. Mathematician, investor, and analyst Nenad Bakic explains why for Index.hr.
In terms of the number of deaths per million inhabitants, the new members of the European Union, the countries of the "new European Union", namely the former socialist countries – including, unfortunately, Croatia – are in the lead. Some of them have several tens of times more deaths in the second wave than in the first.
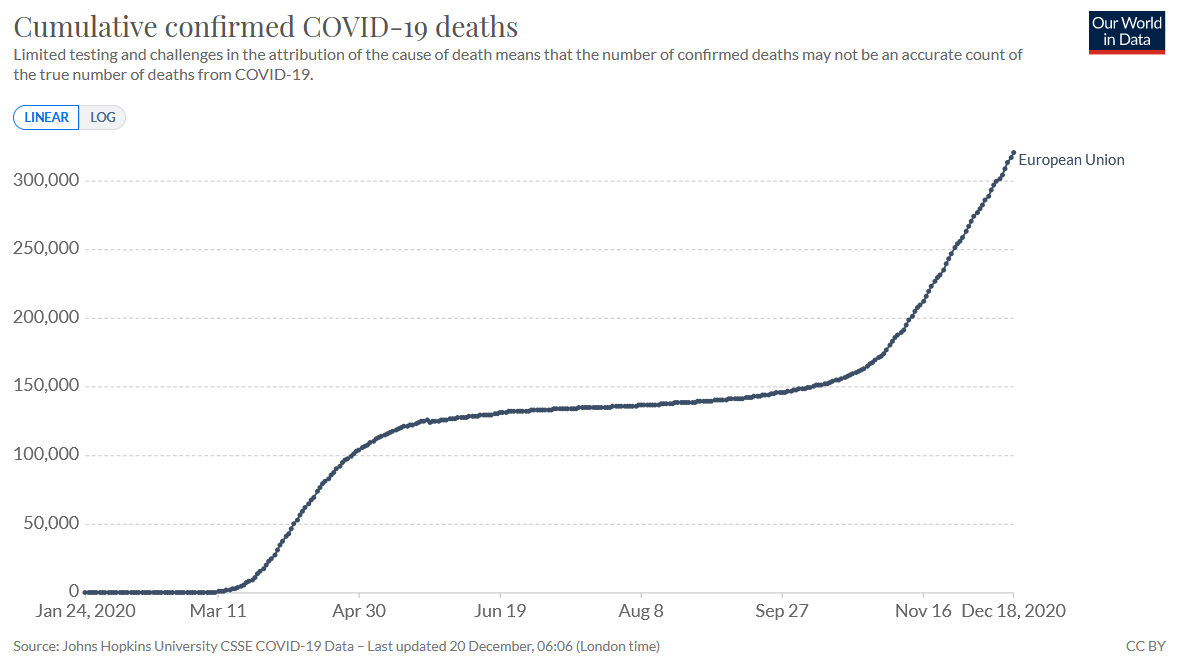
Confirmed cases of death due to coronavirus in the European Union / Source: ourworldindata.org
What is happening? Why did the virus in the second wave become so deadly in the new European Union members? By studying this example, we can learn a lot about the pandemic in general.
- The countries of the New European Union (NE), 11 ex-socialist countries, did very well in the first wave, with only one of them among the 13 most-affected. All the governments of these countries attributed the success to themselves. In some countries like Croatia, it was done by gurus who considered themselves ideologues of barbaric imprisonment or, as they ignorantly called it, "quarantine".
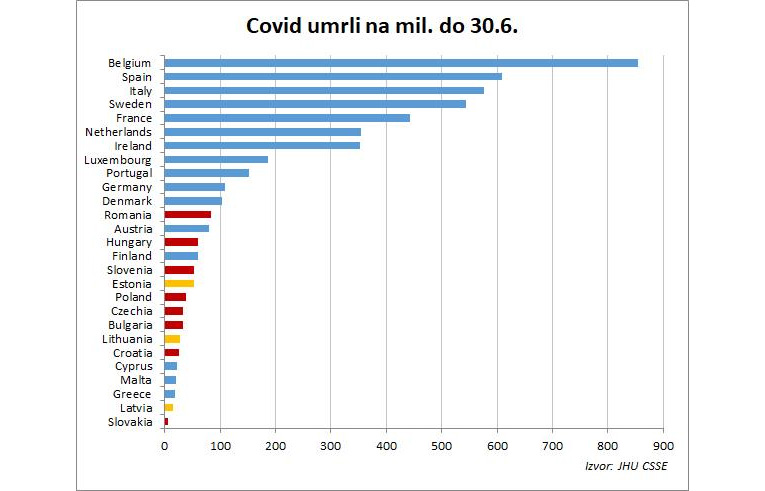
Graph 1. Coronavirus deaths per million, until June 30, 2020. Source: Index.hr / JHU CSSE
They are marked in red on the first graph. A lighter shade highlights the small Baltic countries because something strange is happening there, but it doesn't matter. It is the same when we look at it without this separation.
What is the probability that the NE countries were so much more successful in their will than the older, smarter, and more experienced brothers? Maybe it's something else.
- In the second wave, NE countries were significantly more affected, as we can see in the second graph.

Graph 2. Coronavirus deaths per million, from July 1, 2020 until December 18, 2020. Source: Index.hr / JHU CSSE
Out of the top 8 countries, they occupy seven positions. What is the probability that they are so much more unsuccessful than other countries by their own will? Very small.
Of course, it's easy to recognize a "return to the core value" here – as the virus does what it wants, most countries end up converging to a similar number of deaths. Graph 3 shows the coefficient of variation, which is the standard measure of a set's scatter.

Graph 3. Coefficient of variation, deaths from coronavirus in EU countries per million. Source: Index.hr
Here we can already conclude that the performance of the NE countries as a group has nothing to do with their governments' competencies. The probability that a group with its ability is far above average and then that same group is far below average, especially in a situation like this where the virus spreads across the continent without knowing the boundaries, is zero. Of course, some individual countries are better or worse, both in epidemic management and in treatment.
- But things are only now becoming very interesting. The number of deaths in the second wave not only offset the one from the first wave but also shifted it. The NE countries as a group are now considerably worse than the rest, as we can see in Graph 4.
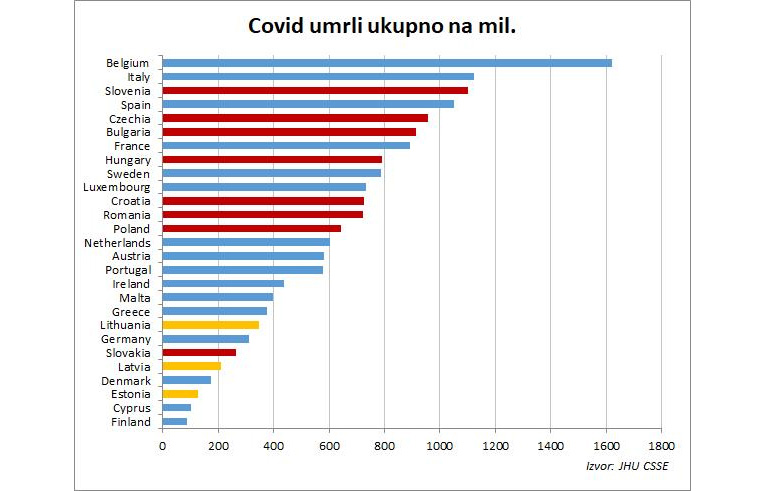
Graph 4. Total coronavirus deaths per million. Source: Index.hr / JHU CSSE
They occupy eight of the first 13 places. If we exclude the small Baltic countries, only Slovakia remains in the lower half, but the situation deteriorates quickly, and it could easily get to the upper half.
As we can see, there is something special about the small Baltic countries and Finland. We still don't know what, and it doesn't matter for this analysis either. If we single out those countries, things become clearer, but the analysis works without them.
- What is the explanation? It can be the following:
- A. It has been shown that COVID-19 is highly seasonal. In NE countries, the epidemic came later in late winter 2020 and therefore could have done much less damage by the time spring came. This is undoubtedly the case with Croatia, as you can see in Graph 5: the reproductive factor R fell below 1 already before the end of March, before the measures were introduced on March 23 in Croatia and could take effect.
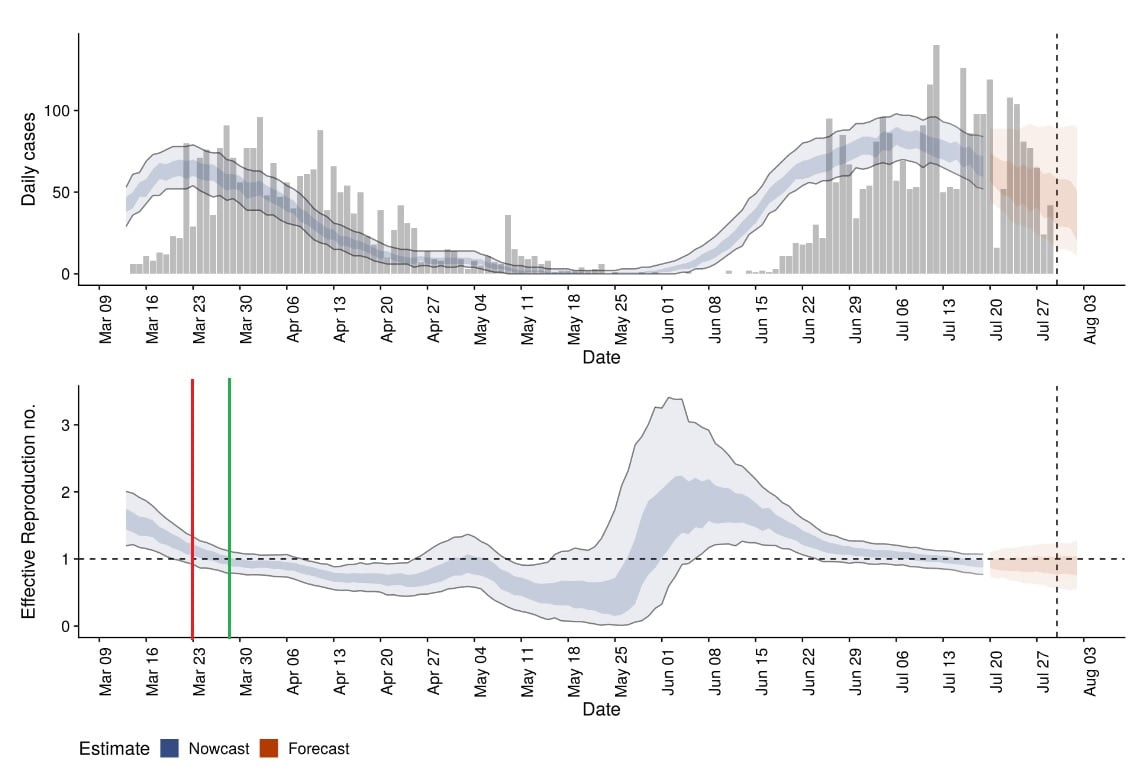
Graph 5. Source: Index.hr
The introduction of a movement prohibition and a drop in R below 1 are marked with a red and green line. An international group of the London School of Health and Tropical Medicine made this calculation, in which a member of the Croatian Scientific Council also participated. Somehow they later forgot to let us know that R had already fallen below 1 even then. However, at the beginning of the epidemic, everything was explained with its help, which advanced countries are doing now. From a time perspective, all of this is now obvious, and that first wave seems completely benign compared to this one now.
But let's remember the psychosis in which we lived then when the concept of "Camp Croatia" with GPS tracking and leaving the house every third or fifth day was already announced when the epidemic was already falling. Inexperienced and impressed by the violent measures, we thought they helped.
But why did the epidemic come later? Here I think the key is in international connectivity. I used an imperfect DHL connectivity index and got a great explanation of the difference, which can be seen in the following chart.
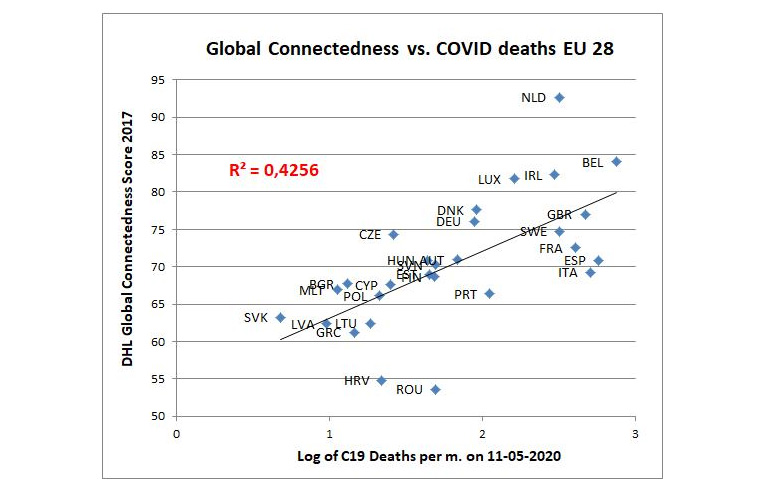
Graph 6. Source: Index.hr
Interestingly, even such an imperfect measure of connectivity explains so much of the variation. As we know, the most affected countries are also the most connected: Italy – densely populated Lombardy and workers from China; Italy, France, Spain – tourism; Belgium – the center of the European Union and others; Sweden – far more connected than its neighbors; and a million Swedes went on school holidays abroad in the last week of February.
- B. The first wave was actually far stronger than it seems now because we tested and hunted cases much less. Many countries found that their dark number (undiscovered cases) was several tens of times higher than those found. In our country, depending on the interpretation of the data, 50 to 80 times, in Denmark 80 (at some point). Now the dark number is probably 5 to 10 in most countries, and the current maybe even just 3 because as more and more people are being tested, and more and more people have been exposed to the virus, the significant dark number has nowhere to hide.
Therefore, most of the countries of old Europe became infected in the spring, a part of the population gained immunity, and significantly more than in the NE, which we cannot see well if we look only at the cases.
- C. It is now quite clear that strongly seasonal is not only an epidemic of SARS-CoV-2 virus but also COVID-19 disease. Clinical pictures are, on average, far more difficult now than a month or two ago. Mortality rates in most EU countries have doubled in just a month or two, meaning twice as many people die among those confirmed infected. It is also the insight of an international group of scientists in which Croatians Gordan Lauc, Alemka Markotić, Dragan Primorac, and others also participated. At first, it was controversial, but now it is generally accepted. Those infected in spring (more in the old than in the NE) had a much better chance of surviving.
- D. One explanation indeed lies in the quality of hospital systems. I believe richer countries have more resources. For example, expensive HFOT devices save lives better than respirators (Croatia has now procured a larger quantity).
- E. Other variables could be considered, such as previous flu seasons, the percentage in the population over 80, or the people in nursing homes. Still, I believe they would indicate a lower expected number of deaths in the NE (but I did not check the data).
In general, the NE countries, including Croatia, were not particularly unprepared for the supposedly expected strong second wave. Let's look at how strength and early outbreak surprised even the most advanced countries, with entirely different strategies: from Germany through Denmark and the Netherlands to Sweden. Remember that in almost all countries, politicians said "let's just wear masks, and we won't need any special measures," then "let's introduce some measures, and we certainly won't need lockdown," and so on. Now we have reached a solid lockdown in almost the entire Union.
Even Germany, the first wave model, is experiencing a real drama after a failed soft lockdown that was supposed to ensure a peaceful Christmas. Denmark and some other countries are already overtaking us in terms of the number of infected. It is not impossible for Germany to overtake us, even in terms of deaths.
In some countries, a third or "second B" wave is already being born, under the influence of winter COVID-19. R is contextual, and even if it falls below 1, under the influence of various circumstances, it can return over 1. It seems that our second wave peak was delayed by merging with that (surprising to all) the third wave.
Conclusion
- The development of the epidemic is mostly beyond the reach of the authorities.
- Countries with stronger measures do not fare better than those with weaker ones. For example, Slovenia is the worst in this group, despite introducing extreme measures before the epidemic escalated.
- The introduced travel ban is not useful. The inspiration for it was the spring ban, which was considered our most important measure, and obviously did not affect the epidemic.
- On the whole, we are not somewhat more unsuccessful than others. Indeed, although some have had significantly stronger measures for longer (this is one group we can compare ourselves to, and the other is our neighborhood shown in Graph 7, and only Serbia is better than us), we should consider any success or failure relatively. It is known that some measures work, such as banning gathering, maintaining physical distance, washing hands, ventilation, etc. The introduction of measures should be proportionate to the goal because the disproportionate introduction of measures has severe negative consequences for society. Countries that introduce brutal and unnecessary measures (there are arguments that some brutal measures even encourage an epidemic) can also cause significant collateral damage to their populations' lives and health.
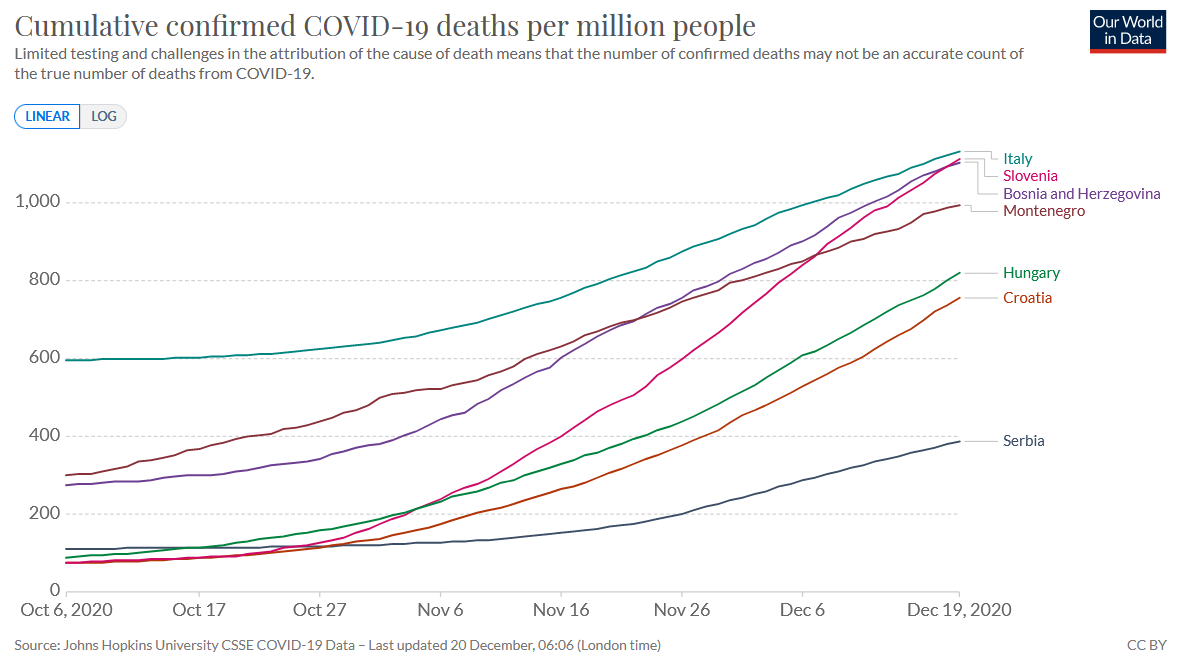
Graph 7. Showing data from October 6, 2020 to December 19, 2020. Source: ourworldindata.org
Let's not forget, the goal in epidemic control is to bring the reproductive factor R below 1, and "zero-covid" strategies have long since been abandoned. Fortunately, in Croatia, R is currently significantly below 1. Let's hope that the data on the epidemic we have are credible and that such a situation will persist.
Of course, the main goal is to save as many lives as possible, although we are often helpless with the virus. Therefore, it is necessary to adhere to epidemiological measures with enhanced protection of vulnerable groups.
To read more about coronavirus in Croatia, read TCN's dedicated page.
Croatia Among Most Efficient EU Countries in VAT Collection
ZAGREB, Sept 10, 2020 - Differences between expected VAT revenues and revenues actually collected in EU member states are still high despite a slight improvement, and Croatia is among the most efficient countries in VAT collection, the European Commission said on Thursday.
The Commission released data for 2018 showing that the member states lost an estimated €140 billion in expected Value-Added Tax (VAT) revenues.
There were great differences among the member states. The highest national VAT gap was recorded by Romania, with 33.8% of VAT revenues going missing in 2018, followed by Greece (30.1%) and Lithuania (25.9%). The smallest gaps were in Sweden (0.7%), Croatia (3.5%), and Finland (3.6%). In absolute terms, the highest VAT gaps were recorded in Italy (€35.4 billion), the United Kingdom (€23.5 billion), and Germany (€22 billion).
In 2018, Croatia collected €252 million less VAT revenue than expected.
"Although the overall VAT Gap, which is the difference between expected VAT revenues in EU member states and those actually collected, is still extremely high, it has slightly improved in recent years. However, figures for 2020 forecast a reversal of this trend, with a potential loss of €164 billion in 2020 due to the impact of the coronavirus pandemic on the economy," the Commission said.
"The considerable 2018 VAT Gap, coupled with forecasts for 2020 -- which will be impacted by the coronavirus pandemic -- highlights once again the need for a comprehensive reform of EU VAT rules to put an end to VAT fraud, and for increased cooperation between the Member States to promote VAT collection while protecting legitimate businesses," it added.
"Today's figures show that efforts to shut down opportunities for VAT fraud and evasion have been making gradual progress -- but also that much more work is needed. The coronavirus pandemic has drastically altered the EU's economic outlook and is set to deal a serious blow to VAT revenues too. At this time more than ever, EU countries simply cannot afford such losses. That's why we need to do more to step up the fight against VAT fraud with renewed determination, while also simplifying procedures and improving cross-border cooperation," said Paolo Gentiloni, Commissioner for Economy.
For the latest travel info, bookmark our main travel info article, which is updated daily.
Read the Croatian Travel Update in your language - now available in 24 languages
Join the Total Croatia Travel INFO Viber community.
Croatia Among EU Countries with Highest Increases in Jobless
ZAGREB, July 2, 2020 - In May 2020, Croatia was among five EU member states with the highest increase in unemployment compared to April, the EU's statistical office, Eurostat, said in a report on Thursday, reflecting the economic consequences of the coronavirus pandemic.
Many European countries are trying to prevent job losses with special job keeping measures or forced leave or a shorter working week.
At the same time governments have started gradually relieving lockdown measures and enterprises have begun operating and employing again.
Eurostat underscored that the COVID-19 pandemic has resulted in an unprecedented situation on the labour market so that additional indicators will be included in future reports including employment, under-employment and potential additional stakeholders on the labour market.
In today's report Eurostat notes that the EU's seasonally-adjusted unemployment rate in May was 6.7%, equal to May 2019. In April unemployment was 6.6%.
A total of 14.366 million men and women in the EU were unemployed in May 2020. Compared to April that number increased by 253,000.
Croatia alongside Lithuania and Latvia
The seasonally-adjusted unemployment rate in Croatia in May was 8.9% or 0.8 percentage points higher than in April.
A total of 164,000 Croatians were out of work in May or 16,000 more than in April and 44,000 more than in May 2019.
Croatia is alongside Lithuania and Latvia which too recorded an increase in unemployment in May of 0.8 percentage points.
Cyprus recorded the biggest increase in unemployment (+1.3 p.p.).
The lowest unemployment rates in May were recorded in Spain (14.5%) followed by Cyprus (10.2%).
The marked rise in youth unemployment
In May 2020, 2.815 million young persons (under 25) were unemployed in the EU.
In May 2020, the youth unemployment rate was 15.7% in the EU, up from 15.4% in the previous month. Compared with April 2020, youth unemployment increased by 64,000 in the EU.