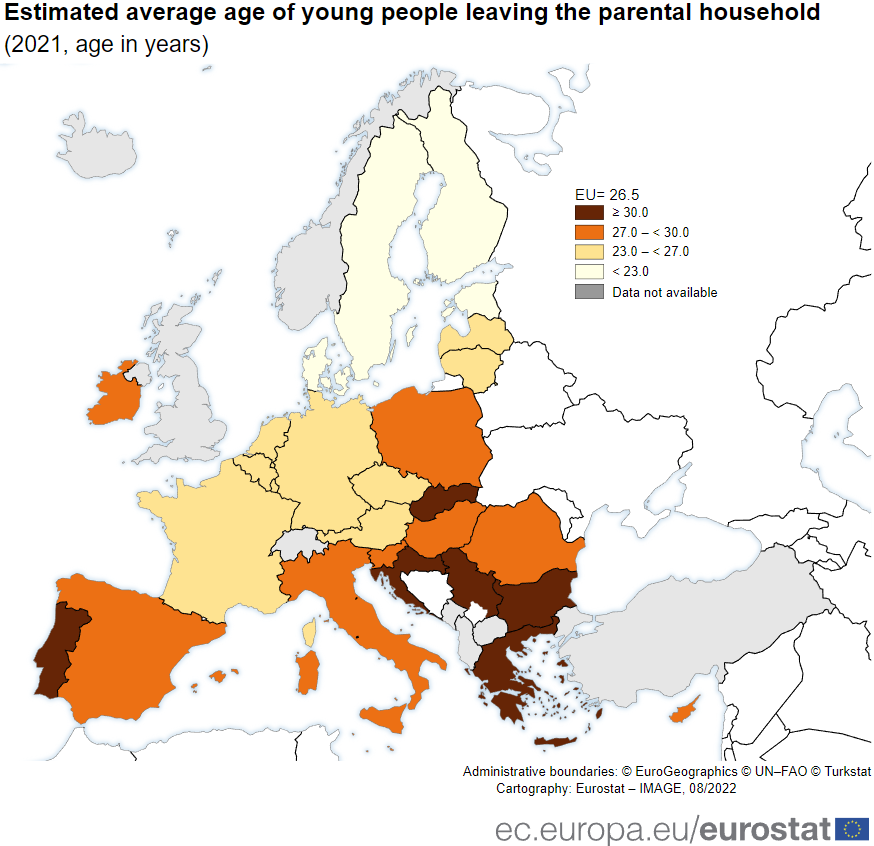
Average Croat Moves Out of Family Home at 33, Only Portuguese Worse
September 4, 2022 - According to Eurostat, the average Croat moves out of their parents' home only at 33.3. Only in Portugal is the number even higher, with some 3 months difference.
As Poslovni reports, young people in Croatia, along with the Portuguese, leave their parents' "nest" the latest. They will leave the family home, on average, only at the age of 33.3. Only the Portuguese who live with their parents three months longer are worse, according to the Eurostat survey for 2021.
Unlike Croats, Portuguese, Slovaks, Greeks, and Bulgarians, countries where young people leave their parents' home on average only at 30 or older, young Swedes will leave at the age of 19. In Finland, on average, at 21.2, in Denmark at 21.3, and Estonia at 22.7.
Eurostat statistics show drastic differences between countries in leaving the family home among young people. Thus, in most countries of Western and Northern Europe, on average, young people leave their parents in their early or mid-20s. On the other hand, in southern and eastern countries, this average rises to the late 20s or early 30s.
Nikola Baketa, a research associate from the Institute for Social Research in Zagreb, states that there are several reasons why young Croats leave their parents' homes late, but the main ones are economic.
"There are several aspects. The first is employment. Young people are more likely to work on a fixed-term basis and are paid less, which affects the safety and security of work. In such a working relationship, it is difficult to get a loan, which is necessary for buying real estate", says Baketa, adding that the purchase of real estate is another problem that causes young people in Croatia to leave their parents’ homes only after 30.
"Real estate and rental prices in Croatia are high. In addition, the rent is irregular. In Croatia, there are no long-term rental policies or affordable city apartments that would make it easier for young people to become independent", he points out.
And the authorities do not seem to care, as demonstrated by the fact that since 2017, when the National Youth Program expired, they have not bothered to bring a new one. That would at least declaratively show how the state plans to ease the position of this very heterogeneous group.
The consequences are becoming apparent, as fewer and fewer people remain in Croatia, and it is the young who most often leave the country.
Interestingly, statistics show that men in the European Union leave the family home later than women. On average, they are 27.4 years old, and women are 25.5 years old. This trend is present in all countries, say European statisticians.
Baketa assumes that this is because women get married and leave their homes earlier. But as he points out, this is only an assumption.
For more, make sure to check out our Lifestyle section.
Croatian IT Sector Wages Lowest in European Union
May the 25th, 2022 - Croatian IT sector wages continue to be the lowest in the entire European Union (EU) despite the fact that this rapidly blossoming field has experienced a very real boom over the last few years.
As Poslovni Dnevnik/Marija Brnic writes, the cost of paying out wages for EU-based employers has continued to rise in most countries, with the exception of a few countries that stalled in 2020 and continued to grow, including the Republic of Croatia.
According to a quarterly analysis of labour market trends by the Croatian Bureau of Statistics (CBS), based on Eurostat data, only Ireland, Croatia and Cyprus had a temporary halt in gross hourly wage growth, while in Spain and Italy, gross hourly wages rose in the first year of the coronavirus pandemic, but last year they ended up below the levels seen back in 2020.
The level of wage costs paid by employers per hour with all costs varies significantly between EU member states, from 7 euros in Bulgaria and 8.5 in Romania, to 41.6 euros in Belgium, 43 in Luxembourg and 46.9 in Denmark.
Compared to Croatia, where the average hour of work costs an employer around 11.2 euros, Bulgaria and Romania have a lower hourly rate, as do Latvia and Hungary, and employers in Lithuania and Poland have slightly higher costs to deal with. In neighbouring Slovenia, with which Croatia often likes to compare itself, the gross hourly wage is almost twice as high (21.1 euros).
Given the current alarm bells ringing from certain sectors, primarily hotels and the hospitality and catering field, the lack of qualified workers even despite the abolition of the annual quota system for the employment of foreign (non-EEA) workers, we can expect that in the Croatian case, hourly rates will have stronger growth in the 2020 report, but if we look back three years, wages have fallen in most sectors, with the exception of education, healthcare, entertainment and the arts.
The lowest hourly rates in Croatia were in administrative services (8.3 euros) and hotels and restaurants (8.6 euros), and the highest in the information and communication sectors (15.9 euros), finance (15.5 euros) and science (15.2 euros).
In the EU's finance and insurance sector last year, hourly rates ranged from 9.9 euros in Bulgaria to 77.3 euros in Luxembourg, and in professional, scientific and technical activities, they ranged from 10.9 euros in Bulgaria to a significantly higher 57.9 euros in Denmark.
In healthcare, hourly wages in the EU rose in all countries except Greece, ranging from 8.1 euros in Bulgaria to 45.2 euros in Luxembourg. And although the sector is the largest, Croatian IT sector wages remain the lowest in the entire EU, with Sweden leading in that regard with an impressive 57.7 euros per hour.
When it comes to tourism, last year, ranges from a mere 3.8 euros in Bulgaria to 40.7 euros in Denmark were the norm. Croatian hourly rates were at the level of Estonia, and Cyprus, Latvia, Lithuania, Hungary, Poland, Malta, and Romania take home less per hour.
Looking at other competitors when it comes to sea and sunshine, only in Greece, regardless of the coronavirus pandemic, the price of an hour of work in tourism rose (to 15.2 euros), while in Spain and Italy it decreased slightly last year, and in the Croatian case, last year saw slight recovery, but that recovery failed to reach the record high of pre-pandemic 2019 of 9.1 euros. In neighbouring Slovenia, on the other hand, the hourly wage in the tourism sector stands at 14.6 euros.
In the manufacturing industry, hourly rates last year ranged from 5.8 euros in Bulgaria to 48.5 euros in Denmark, with only Germany, Sweden and Belgium seeing people take home more than 40 euros per hour. Here in Croatia, the price of an hour's work stood at 10.3 euros and is slightly higher than before the pandemic, but it is significantly lower than the sum just across the border in Slovenia (20.3 euros).
They have a lower gross hourly wage than Croatian industrialists in Romania (7.3 euros). In construction, only in Denmark do employees have an hourly salary of more than 40 euros, and the lowest of all can be seen in Bulgaria, Romania and neighbouring Hungary, and Croatian salaries are just over theirs, standing at 10 euros.
In Germany, on the other hand, where Croatian builders like to head to, gross hourly rates are lower than those in the manufacturing industry, which analysts associate with the employment of foreign workers, which increases labour supply and reduces wages. This is not the case, for example, in nearby Austria.
Much like in construction, the Danes are the only ones in trade to have an hourly rate above 40 euros, and the lowest can, once again, be seen in Bulgaria (6.3 euros), which is less than in Croatia (11.1 euros).
For more, make sure to check out our dedicated business section.
Croatia Had One of Lowest Employment Rates in EU in 2021
ZAGREB, 29 April (2022) - In 2021 Croatia was among EU countries with the lowest level of employment, below the European average, a report by the Eurostat statistical office indicates.
In 2021, the share of employed people in the EU population was 73.1%, corresponding to 189.7 million people, up 1.4 percentage points from 2020, the first pandemic year, Eurostat said.
This was a higher rate than for the pre-pandemic year 2019, when 72.7% of the population was employed.
The employment rate in the eurozone in 2021 was 72.5%, the same as in 2019. In 2020 it was 71.2%.
Croatia with one of lowest employment rates
The highest level of employment in 2021 was registered in the Netherlands, Sweden and the Czech Republic, which had employment rates of 81.7%, 80.8% and 80% respectively.
Employment rates of below 70% were registered in Croatia, Spain, Romania, Italy and Greece.
Greece and Italy had the lowest employment rates, of 62.6% and 62.7% of the working-age population employed.
Croatia's employment rate was 68.2%. In 2020 it was 66.9% and in 2019 it was 66.7%.
Spain had an employment rate of 67.7% in 2021.
The gap is decreasing
The majority of EU member states (16) in 2021 achieved or surpassed their 2019 employment rates, with Poland reporting the best result (+3.1 pp).
It was followed by Romania (+2 pp), and Greece and Malta (+1.8 pp each).
Croatia's employment rate increased by 1.5 percentage points compared with 2019.
Latvia is lagging behind its 2019 employment rate the most (-2.0 pp).
For more, check out our business section
Eurostat: Croatia Catches Up with Latvia on GDP Per Capita
28 March 2022 - In 2021, Luxembourg and Ireland recorded the highest levels of GDP per capita expressed in purchasing power standards, while Croatia overtook Slovakia and ranked alongside Latvia, according to Eurostat's flash estimate.
Luxembourg's GDP per capita was 177% above the EU average, while Ireland's was 121% above.
The high GDP per capita in Luxembourg is partly due to the country's large share of cross-border workers in total employment. While contributing to GDP, these workers are not taken into consideration as part of the resident population which is used to calculate GDP per capita, Eurostat said.
The high level of GDP per capita in Ireland can be partly explained by the presence of large multinational companies holding intellectual property. The associated contract manufacturing with these assets contributes to GDP, while a large part of the income earned from this production is returned to the companies’ ultimate owners abroad, Eurostat noted.
Luxembourg and Ireland were followed by Denmark (33% above), the Netherlands (32% above), Sweden (23% above) and Belgium (22% above).
In contrast, Croatia (30% below the EU average), Slovakia (32% below), Greece (35% below) and Bulgaria (45% below) registered the lowest GDP per capita, Eurostat said.
Croatia had made an improvement since 2020, when its GDP per capita was 36% below the EU average, and caught up with Latvia, which was 29% below the EU average in 2021.
France (4% above) and Malta (2% below) were closest to the EU average.
Croatian GDP Growth Among Strongest in EU at End of 2021
March the 9th, 2022 - Croatian GDP growth in the fourth quarter of last year is more than impressive, placing the country among the European Union (EU) member states with the strongest such growth of all.
As Poslovni Dnevnik writes, the Republic of Croatia is among the EU countries with the highest annual GDP growth rate in the fourth quarter of 2021, ranking behind Ireland and Malta and soaring well above the European average, new Eurostat estimates revealed this week.
The EU's seasonally adjusted gross domestic product (GDP) rose 0.4 percent in the fourth quarter of 2021 compared to the previous three months, when it increased 2.2 percent, Eurostat confirmed in its February estimate.
The Eurozone's GDP grew 0.3 percent when compared to the third quarter, when it rose 2.3 percent.
Compared to the same period a year earlier, the seasonally adjusted GDP of the EU as a bloc and the Eurozone increased by 4.8 and 4.6 percent respectively. It rose 4.1 percent in the EU and 3.9 percent in the Eurozone in the previous quarter.
Activity in both the EU and the Eurozone exceeded pre-pandemic levels from back at the end of 2019, by 0.6 and 0.2 percent, respectively, Eurostat determined on the basis of seasonally adjusted data. Throughout 2021, activity in both areas rose 5.3 percent, 0.1 percentage point stronger than Eurostat estimated back in mid-February.
Neighbouring Slovenia is at the helm...
At the annual level, all EU countries form which Eurostat obtained data recorded GDP growth in the fourth quarter of 2021, and the strongest was in neighbouring Slovenia, where it amounted to 10.5 percent.
The Slovenes are followed by Malta and Ireland with a 10 percent increase in activity, and Croatian GDP growth also places it in this group, where it grew by 9.9 percent, after a 15.3 percent jump in the period from July to September. The weakest growth among the countries with Eurostat data was recorded by Slovakia, with 1.2 percent, and Germany is close with a growth rate of a mere 1.8 percent.
Among the countries whose data were available to Eurostat, GDP in Slovenia grew the most on a quarterly basis in the fourth quarter of last year, by 5.3 percent, followed by Malta with 2.3 percent growth and Spain and Hungary, where GDP grew by two percent in both countries.
A decline in activity was recorded in Ireland, by 5.4 percent, in Austria, by 1.5 percent. The same also fell slightly in Germany, by 0.3 percent, and here in Croatia, Latvia and Romania, that fall stood at 0.1 percent. In the third quarter of last year, Croatian GDP growth stood at 1.4 percent on a quarterly basis.
Decreased employment
The number of employees in the EU and the Eurozone increased by 0.5 percent in the last three months of last year compared to the summer quarter, when it increased by 0.9 and one percent, respectively. Compared to the end of 2020, it increased by 2.1 percent in the EU and by 2.2 percent in the Eurozone. Between July and September, it rose 2.1 percent in both areas.
Recovery in Croatia...
Employment in Hungary, Denmark, Malta and Spain accelerated the most on a quarterly basis, ranging from 1.2 to 1.0 percent. Here in Croatia, the number of employees increased by 0.6 percent in the fourth quarter of last year compared to the previous quarter, when it fell by 0.1 percent. On an annual basis, the number of employees in Ireland increased by the most, by 8.4 percent.
When it comes to the growth in the number of employees at the end of last year by 3.6 percent compared to the same period back in 2020, Croatia is equal to Greece, Luxembourg and Malta. In the third quarter, the number of employees in Croatia increased by 1.7 percent on an annual basis. Only Romania saw a 9.1 percent drop in registered employee numbers.
For more, check out our lifestyle section.
Croatian Youth Leaving Country Because They Can't Leave Parental Home?
January the 19th, 2022 - There are many things responsible for the ongoing Croatian demographic crisis, from corruption to salaries to a bad economy, the list goes on and on. Croatian youth typically live with their parents for far longer than we see in most other European countries (with the exception of a few similar ones), could this be why they'd rather take their chances abroad?
As Poslovni Dnevnik/Marija Brnic writes, in the media presentation of the results of last year's damning census, the increase in housing units was singled out as a surprise, but this is not really unexpected.
In the previous census, the one from back in 2011, the same thing happened, the number of inhabitants of the country dropped, and the number of residential buildings increased. The difference is that the then smaller decline in population was accompanied by significantly higher growth in the number of real estate.
Specifically, in 2011, a total of 4.285 million inhabitants were counted in Croatia, ie 153 thousand less than ten years earlier, while in that interval the number of housing units increased by 370 thousand, to 2.247 million buildings.
The latest census recorded 3.889 million inhabitants and 2.350 million housing units.
However, the first data doesn't really give us a complete picture because, according to the president of the Real Estate Association, Dubravko Ranilovic, further processing has yet to reveal whether the reconstruction of the housing ''stock'' has finally begun and then we need to be given an accurate picture of the size, quality and purpose of these facilities. Reconstruction of the housing stock, he says, has been lacking so far.
In addition, the picture will be framed by data on the age structure of the population, as well as how many members of what we consider the Croatian youth have an apartment. So far, the population has been aging, and entering the EU acted as a "booster" for the emigration of Croatian youth.
The previous census from back in 2011 determined the average age of the country's residents to stand at about 42 years, which was three years more than in 2001. Now, of course, ''we'' will be even older, the only question is by how much.
92 percent of men and 84 percent of women under the age of 29 still live with their parents.
Dwellings are important in the overall picture, because one of the most cited problems in the emigration of Croatian youth was their inability to provide housing, independence and leave their parents' home. According to recently published Eurostat data, many households in Croatia are overcrowded, and the amount of Croatian youth still living with their parents is incredibly high.
In Croatia, 36 percent of the population lives in overcrowded homes, although 91 percent of people live in their own property, but these properties are too small, have too few rooms or too many household members. By comparison in the EU, the least overcrowded households are in Ireland, Malta and the Netherlands, where less than 5 percent of the population lives in overcrowded properties/homes.
When looking at the percentage of young people aged 16 to 29 living with their parents, Croatia is the EU record holder, because in those years, most Croatian youth still live with their parents. 92 percent of Croatian men and 84 percent of Croatian women still live ''at home'', while the EU average is 74 percent of men and 64 percent of women.
This matter will be made even clearer if it is known that apartments in Croatia make up only a quarter of the properties in the country, which might come as a surprise to some, so it is even clearer why young people find it much more difficult to stand on their own two feet and become independent.
Eurostat also found that from 2010 to the end of the third quarter of 2021, Croatian property prices, both for purchase and rent, were significantly below the EU average. Croatia is therefore among the countries with the lowest growth, and interestingly, the largest increase was in countries where Croatian youth tends to migrate, such as in Germany and Austria when it comes to selling prices, and Ireland when it comes to rent.
However, the prices themselves, although lower in Croatia than in Western European countries, are not crucial, according to Ranilovic, because it is noticeable that they fell in the areas from which the most people emigrated in recent years, and in those areas there were fewer transactions anyway. In addition, Ranilovic stated that as many as a quarter of Croatian property purchases, about 7,000 of them, were made by foreigners in Croatia last year.
For more, check out our dedicated politics section.
Croatia Among EU States With Biggest Industrial Output Drops in July Month-Over-Month
ZAGREB, 15 Sept, 2021 - Europe's industrial production recovered in July 2021 but Croatia was among the EU countries with the largest monthly decreases, an Eurostat report showed on Wednesday.
In July 2021, the seasonally adjusted industrial production rose by 1.5% in the euro area and by 1.4% in the EU, compared with June 2021, when industrial production fell by 0.1% in the euro area and remained stable in the EU.
In the euro area in July 2021, compared with June 2021, production of non-durable consumer goods rose by 3.5%, while in the EU it rose by 2.8%.
Capital goods went up by 2.7% in the euro area and by 2.4% in the EU, and intermediate goods by 0.4% in the euro area and by 0.5% in the EU, while energy production was stable in the EU and fell by 0.6% in the euro area.
Among member states for which data are available, the highest monthly increases were registered in Ireland (+7.8%), Belgium (+5%) and Portugal (+3.5%). The largest decreases were observed in Lithuania (-2.0%), Slovenia (-1.8%) and Croatia (-1.6%).
In July 2021 compared with July 2020, industrial production increased by 7.7% in the euro area and by 8.3% in the EU.
In the euro area in July 2021, compared with July 2020, production of intermediate goods rose by 11.2%, nondurable consumer goods by 10.1%, durable consumer goods by 9.8%, capital goods by 5.9% and energy by 1%.
In the EU, production of intermediate goods rose by 11.8%, non-durable consumer goods by 9.4%, durable consumer goods by 8.9%, capital goods by 6.3% and energy by 2.7%.
For more about business in Croatia, follow TCN's dedicated page.
Croatian Purchasing Power Rises, Country Still Among EU's Worst
June the 24th, 2021 - Croatian purchasing power has risen a little, but the country unfortunately still remains ranked among the European Union's very worst as the tremendously devastating effects of the coronavirus pandemic continue to be more than evident.
As Poslovni Dnevnik/Ljubica Gataric/VL writes, after falling during and owing to the year dominated by the ongoing coronavirus pandemic, the Republic of Croatia dropped to 64 percent of the value of the average GDP of the European Union per capita in 2020, down from 65 percent back in pre-pandemic 2019, thus cementing its status as the second poorest EU member state. Croatia is as such ranked alongside Greece and is just behind Bulgaria.
Looking at Croatian purchasing power by actual individual consumption (AIC), Croatia has jumped by 1 percentage point to 67 percent of GDP due to falling prices, but it is still the second worst position within the bloc.
Romania, on the other hand, raised its GDP per capita to 72 percent, ahead of Slovakia, while in real individual consumption it was 79 percent. Last year, according to Eurostat, the AIC per capita expressed in purchasing power standards (PPS) ranged from 61 percent to 131 percent of the European Union average.
Nine EU member states have a standard which is deemed to be above average, most notably the very rich country of Luxembourg, which is an impressive 31 percent above the EU average, followed by Germany (23 percent above) and Denmark (21 percent). The Netherlands, Austria, Finland, Belgium, Sweden and France were all 5–20 percent above the EU average also.
In Cyprus, Italy, Lithuania and Ireland, levels were 10 percent or less than average, while Spain, the Czech Republic, Portugal, Malta, Poland and Slovenia lagged 11-20 percent behind. Estonia and Greece were 21-25 percent below the EU average. Slovakia, Latvia, Hungary and Croatia are down by an average of 25-33 percent.
For more, make sure to follow our dedicated lifestyle section.
EU Industrial Production Stabilises in March; Croatia Above EU Average
ZAGREB, 12 May, 2021 - The European Union's industrial production stabilised in March following a decline in the previous month, while Croatia's production grew above the bloc's average rate, according to a report released by Eurostat on Wednesday.
In March 2021, the seasonally adjusted industrial production rose by 0.6% in the EU and by 0.1% in the euro area, compared with February 2021. In February 2021, industrial production fell by 1.0% in the EU and by 1.2% in the euro area.
In both regions, the recovery was driven by production of non-durable consumer goods, which rose by 2.0% in the EU and by 1.9% in the euro area, compared with February 2021.
Production of intermediate goods rose by 1.1% in the EU and by 0.6% in the euro area. The energy sector also recorded a rise, of 1.0% in the EU and of 1.2% in the euro area.
On the other hand, production of capital goods fell by 0.4% in the EU and by 1.0% in the euro area, and production of durable consumer goods decreased by 0.3% in the EU and by 1.2% in the euro area.
Among member states for which data are available, the highest increases were registered in Denmark (+4.9%), Lithuania (+4.5%) and Bulgaria (+3.7%). The largest decreases were observed in Luxembourg (-4.4%), Belgium (-4.0%) and Finland (-2.1%). Croatia saw a monthly drop in industrial production of 3.4%.
Annual comparison
In March 2021 compared with March 2020, industrial production increased by 11.0% in the EU and by 10.9% in the euro area. In February 2021, industrial production fell by 1.4% in the EU and by 1.8% in the euro area.
Production of durable consumer goods rose the most, by 34.4% in both regions. Production of capital goods increased by 15.9% in the EU and by 16.1% in the euro area, production of intermediate goods rose by 13.4% in the EU and by 13.3% in the euro area, production of energy went up by 2.7% in the EU and by 3.3% in the euro area, and production of non-durable consumer goods increased by 1.1% in the EU and by 0.7% in the euro area.
Among member states for which data are available, the highest increases were registered in Italy (+37.7%), Slovakia (+24.5%), Hungary and Poland (both +16.3%). Decreases were observed in Malta (-2.8%) and Finland (-2.2%). In Croatia, industrial production rose by 9.9% year on year.
For more about business in Croatia, follow TCN's dedicated page.
Croatia Among EU Countries with Highest Increase in Volume of Retail Trade in February
ZAGREB, 12 April, 2021 - The volume of retail trade in the EU rose in February 2021 the most in Belgium, Austria and Croatia, while on average Europeans shopped less, shows a Eurostat report released on Monday.
In February 2021, the volume of retail trade in the EU dropped by 2.2% compared to February 2020. In January it was down 4.5%.
The euro area, too, saw a year-on-year drop in the volume of retail trade of 2.9%, after a 5.2% drop in January.
In both the EU and the euro area the volume of retail trade dropped the most for automotive fuels, by 11.9% and 13% respectively.
The volume of retail trade for non-food products dropped significantly as well, by 4% in the EU and by 5.5% in the euro area, the exception being the volume of trade for mail and internet orders, which jumped by 37.9% in the EU and by 37.3% in the euro area.
In February Europeans bought more only food, drinks and tobacco products, as evidenced by a year-on-year increase of the volume of retail trade of 1.8% in the EU and 1.9% in the euro area.
Belgium, Austria, Croatia report highest increases
Among the countries whose statistics were available to Eurostat, Portugal saw the biggest year-on-year drop in the volume of retail trade, of 15.4%.
It was followed by Slovakia and Malta with declines of 14.7% and 8.9% respectively.
The biggest year-on-year increase in the volume of retail trade was reported by Belgium, of 11%, followed by Austria, with an increase of 5.2% and Croatia, an increase of 5.1%.
In January 2021 Croatia saw a year-on-year 0.9% increase in the volume of retail trade.
Signs of recovery
The seasonally-adjusted volume of retail trade in the EU grew in February by 2.9% compared to January, when it dropped by 4.6%.
In the euro area it went up by 3% from January, when it dropped by 5.2%.
The volume of retail trade for non-food products grew the most in both the EU and the euro area, by 6.2% and 6.8% respectively, after it went down at the start of the year.
The volume of retail trade for automotive fuels recovered as well, by 2.4% in the EU and 3.7% in the euro area.
The volume of retail trade dropped on the month only for food and tobacco products and drinks, by 0.8% in the EU and 1.1% in the euro area.
Among the countries whose statistics were available to Eurostat, the biggest monthly increase in the volume of retail trade was reported by Austria, of 28.2%.
It was followed by Slovenia and Italy, with a 16.4% and an 8.4% increase in the volume of retail trade.
In Croatia the volume of retail trade in February grew 4.4% from January, when it rose by 3.4%.
Monthly drops in the volume of retail trade were reported by Malta (-1.5%), France (-1.2%), Hungary (-1.2%), Portugal (-0.7) and Finland (-0.4).
To read more news from Croatia, follow TCN's dedicated page.